cartoGRAPHs | A Framework for Interpretable Network Visualizations
Networks offer an intuitive visual representation of complex systems. Important network characteristics can often be recognized by eye and, in turn, patterns that stand out visually often have a meaningful interpretation. However, conventional network layouts are difficult to interpret, as they offer no direct connection between node position and network structure.
The approach, proposed here, directly encodes arbitrary structural or functional network characteristics into node positions in two- or three-dimensional space to demonstrate the power of network visualizations for elucidating structure to function relationships in large-scale biological networks.
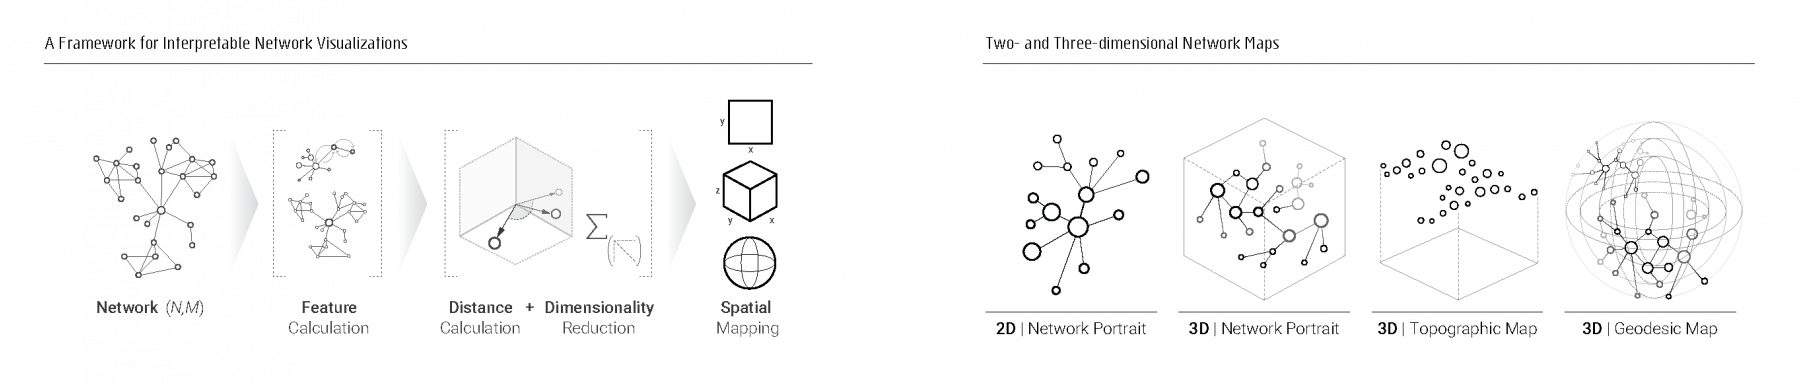
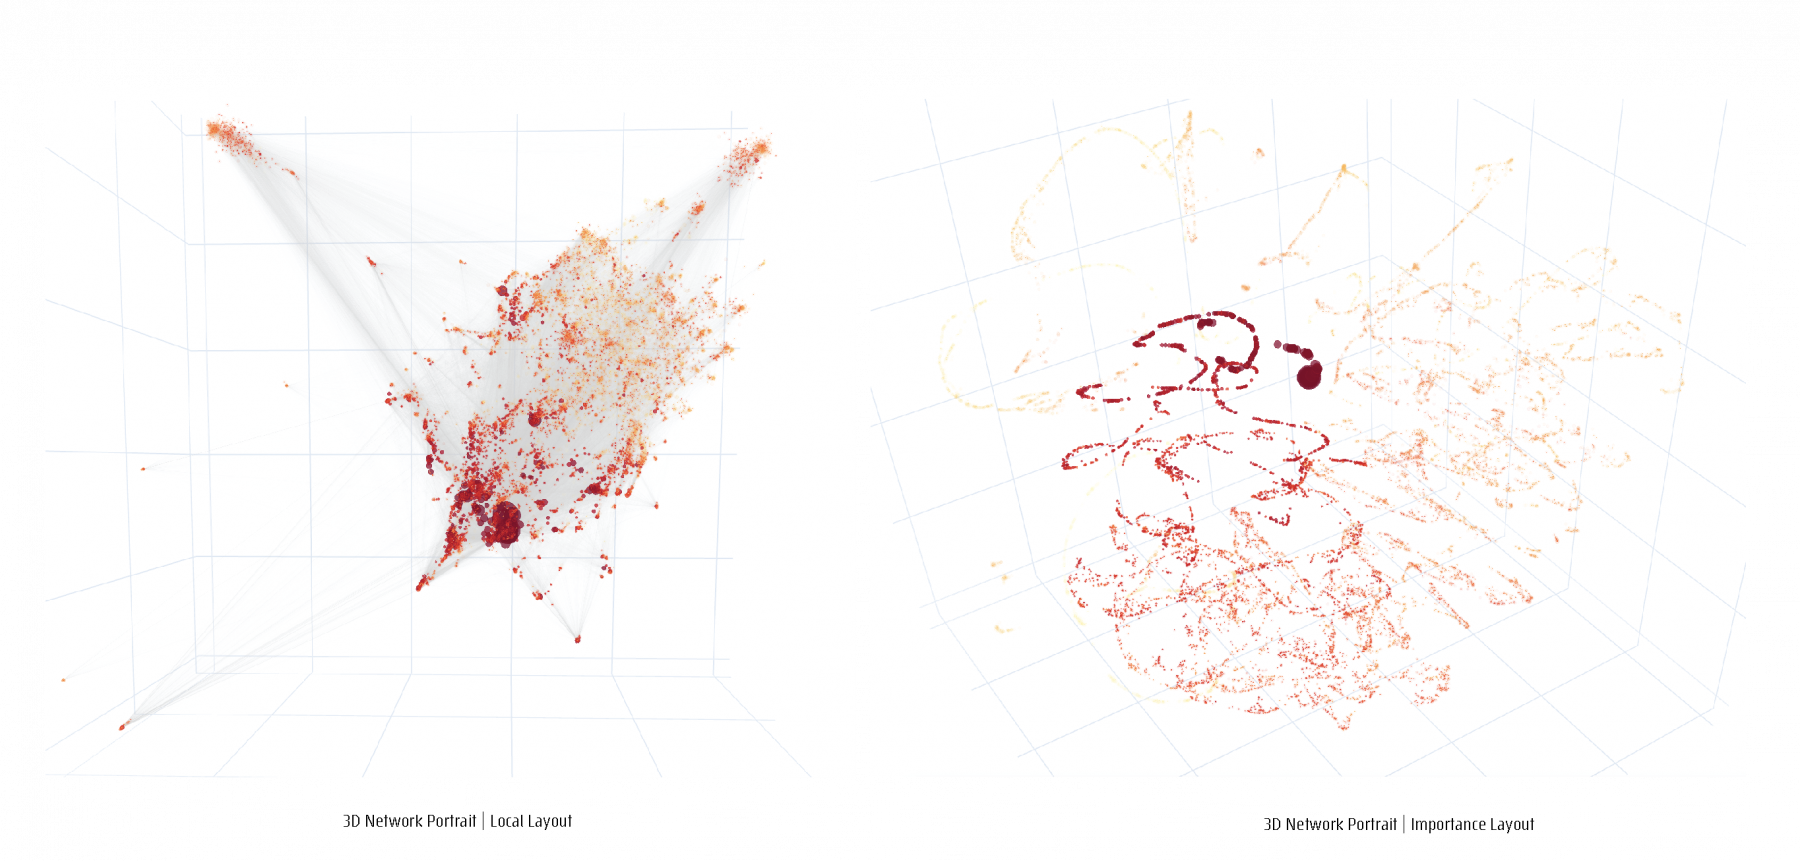
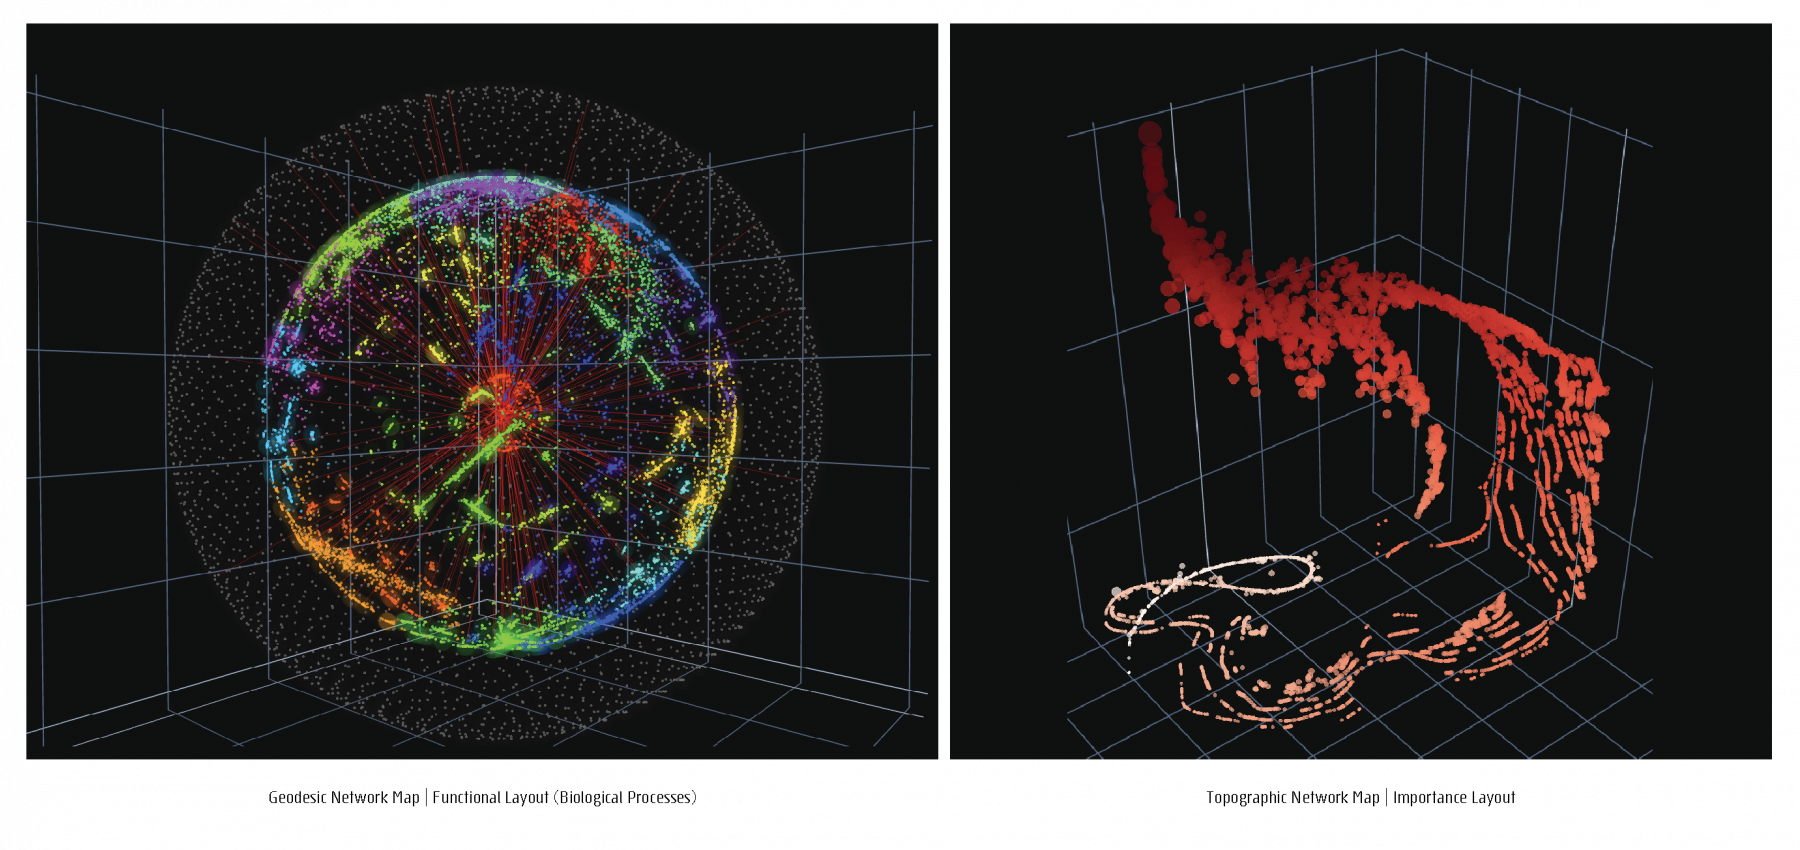
For a given network, a feature matrix is constructed, incorporating any structural of functional characteristics tailored to a specific study focus. The resulting feature matrix is converted into a distance matrix to serve as the input to a dimensionality reduction step. Four different Network layouts, based on four different data-inherent features can be chosen to generate four different network maps, 2D and 3D portraits, topographic and geodesic network maps.
The key advantage of the proposed framework, offering both versatility and interpretability, is its ability to incorporate and explicitly display any desired node characteristic or node pair relationship to offer a solution to a fundamental challenge in graph drawing, namely how to visualize large networks in a comprehensible, interpretable fashion to guide the search for meaningful structure to function relationships. The source code can be found here: github.com/menchelab/CartoGRAPHs
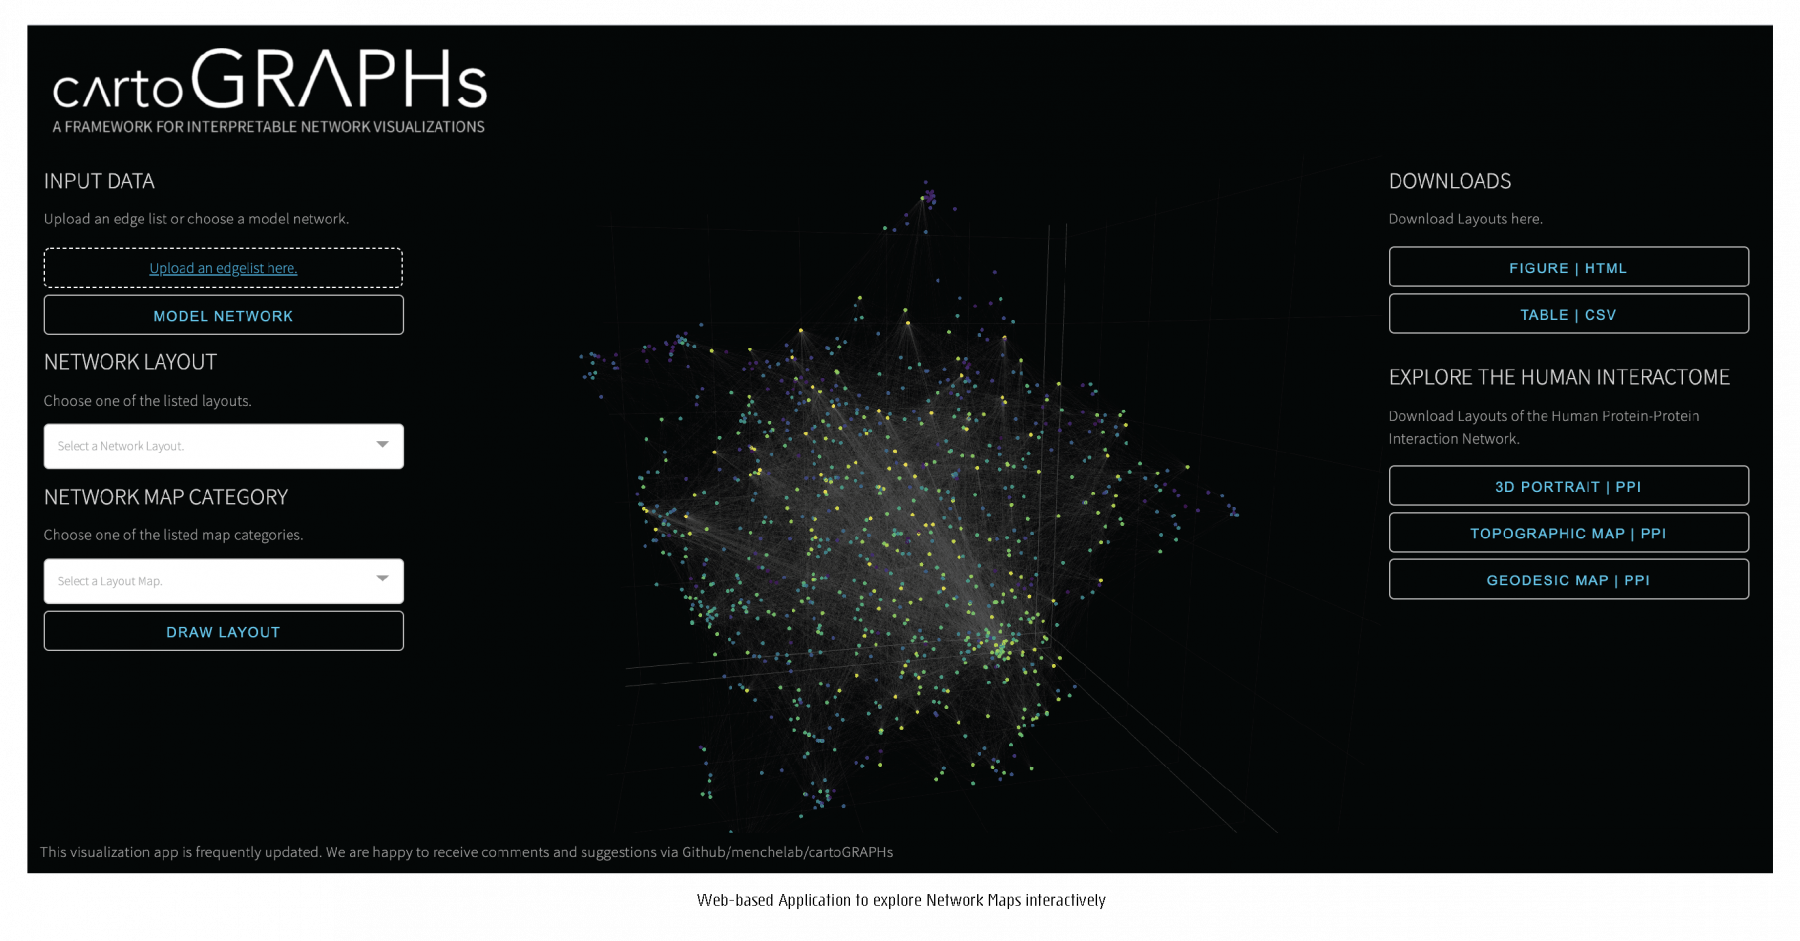
github.com/menchelab/cartoGRAPHs_app
Projections of 3D network visualizations
To explore networks intuitively through a variety of network layouts and maps through an interactive web-based application, click here.